Calendar Spreads: Harvesting Time Across Two Expirations
Calendar Spreads: Harvesting Time Across Two Expirations
Every options strategy on this blog so far has lived in a single expiration date. Calendar spreads break that pattern. They simultaneously trade two options in two different expiration cycles — exploiting the fact that theta decay is not uniform across time.
It’s a more nuanced setup than a simple credit or debit spread, but for traders who understand the mechanics, it opens a powerful toolkit for generating income when stocks are calm and for positioning ahead of volatility events.
The Core Idea: Theta Is Faster Near Expiration
By now you know that theta decay accelerates as expiration approaches. A 30-DTE option decays much faster than a 60-DTE option. Calendar spreads exploit this rate difference directly.
The setup:
- Sell a near-term option (typically 20–30 DTE) — this short-dated option decays faster
- Buy the same option at a further-out expiration (typically 50–75 DTE) — this slower-decaying option retains value
Net result: a net debit trade (the longer-dated option costs more), but a position that collects accelerating theta from the near-term short while the far-term long retains value more slowly.
Building a Calendar Spread
Example — AAPL at $170, expecting the stock to stay quiet:
Sell 1x AAPL $170 Call, 30 DTE    →  receive $4.00
Buy  1x AAPL $170 Call, 75 DTE    →  pay    $5.80
─────────────────────────────────────────────────
Net debit:                          $1.80/share = $180 per spread
Both options are at the same strike ($170 ATM) — this is a “horizontal spread” or “time spread.” The position profits if the stock stays near $170 over the next 30 days, allowing the short option to decay faster than the long option.
The P&L Profile: A Curved Tent
Unlike single-expiration spreads, a calendar spread’s P&L at near-term expiration isn’t a simple V-shape or flat line. It’s a curved tent that peaks at the strike and slopes away on both sides.
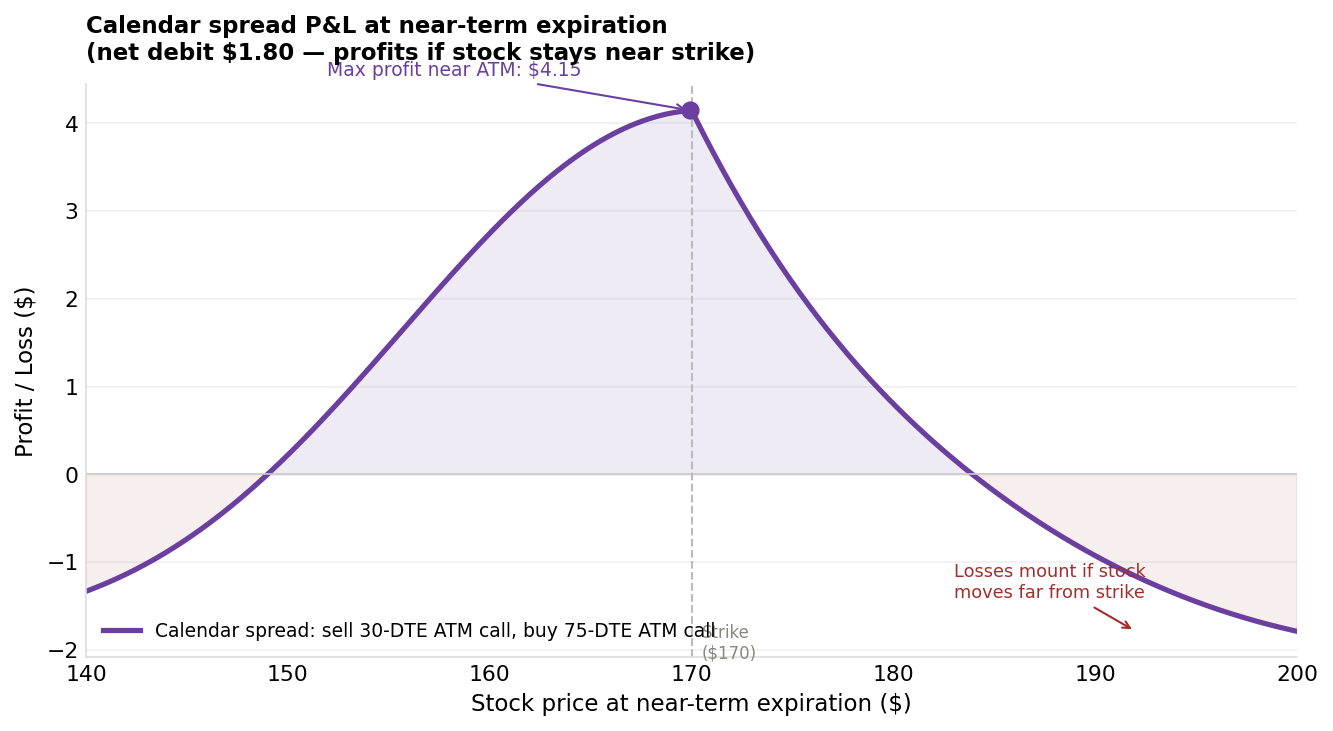 The calendar spread delivers maximum profit when the stock is near the strike at near-term expiration. Both large moves up and large moves down cause losses — but the long-dated option retains residual value.
Why the curve? At near-term expiration:
- The short option has expired (you’ve collected its full time value)
- The long option still has 45 DTE remaining and still carries time value, which increases if the stock is near the strike
If the stock has moved far from the strike in either direction, the long option is either deep ITM (where its remaining time value is minimal) or deep OTM (where it’s nearly worthless). The sweet spot is directly at the strike, where the far-term option retains maximum time value.
Key dynamics:
Max profit = Approximately the difference in time values at the strike, minus the initial net debit Max loss = Net debit paid (if stock makes a large move in either direction) Profit zone = Roughly the range where the short option expires and the long option retains sufficient value
The Greeks in a Calendar Spread
Calendar spreads have a distinctive Greek profile that differs from all previous strategies:
Theta (θ): Positive — The near-term short option decays faster than the long-term long option. Passing time helps the position. This is the primary source of profit.
Vega (ν): Net positive — The far-term option has more vega than the near-term option, so the calendar has net positive vega. In general, a broad rise in implied volatility across all expirations tends to benefit the position. However, this relationship depends on how IV moves across the term structure, not just whether overall IV rises.
If IV rises proportionally across both expirations — or if back-month IV rises more than front-month IV — the calendar performs as expected. But if front-month IV spikes significantly more than back-month IV (which can happen when risk is concentrated in the near-term event, such as an imminent earnings announcement), the short near-term option can gain more cost-to-close than the long back-month option gains in value — and the position can lose money despite overall IV rising. Watch the term structure, not just the IV level.
This is the reverse of credit spreads and iron condors, which are short vega. A trader who sells iron condors and buys calendar spreads has some natural vega hedging.
Delta (Δ): Near zero initially — The same-strike structure is initially delta-neutral. As the stock moves, delta develops.
Gamma (Γ): Negative near-term, positive longer-term — Complex; the net gamma depends on time remaining on both legs.
Two Reasons to Trade a Calendar Spread
Reason 1: Quiet Period Income (Theta Harvest)
When a stock is expected to be range-bound — perhaps the sector is quiet, earnings are far away, and price action is consolidating — a calendar spread at the current price collects steady theta over 2–4 weeks with limited capital at risk.
Best conditions: IVR flat-to-declining (not extreme), stock technically range-bound, no major catalysts in the near-term expiration.
Reason 2: Pre-Earnings IV Expansion Play
Because calendars have net positive vega, buying a calendar before an earnings announcement can position you to profit from the IV buildup leading up to the event — but only if the back-month IV rises alongside (or more than) the front-month IV.
You sell the near-term option in the expiration just before earnings, and buy the next expiration out. As earnings approach, IV typically rises on both legs — and if the back-month option gains more vega-driven value than the front-month loses, the position profits. You close before the actual announcement to avoid the IV crush.
Important: This is a more advanced use of the calendar and carries meaningful complexity. The trade works best when the IV term structure is in contango (back-month IV higher than front-month) or moves that way as earnings approach. If the market concentrates its fear entirely in the front-month expiration — flattening or inverting the term structure — the calendar can underperform or lose even as overall IV rises. This requires careful timing, experience reading the IV term structure, and should be sized conservatively.
Managing Calendar Spreads
Exit Strategy
Profit target: Close at 25–35% of the net debit paid. Because calendar profit potential is bounded, the incremental returns from holding longer are often not worth the additional gamma and vega risk. Some traders target 50% return on risk — close when the position has gained 50% of what was paid.
Loss limit: Close if the position has lost 50% of the initial debit. Large stock moves that break the tent shape quickly erode value. If the stock has moved significantly away from the strike, close and reassess.
Rolling the Short Option
If the near-term option expires worthless (best case), you now hold only the long-dated option. You can:
- Let the long run and trade it directionally
- Sell another near-term option against it — effectively turning the calendar into an ongoing cycle (similar concept to the wheel, but with time spreads)
- Close the long and take any remaining profit
Calendar Spreads vs. Straddles: Both ATM, Different Approach
Both calendars and straddles are placed ATM and care about stock movement. But they differ fundamentally:
| Feature | Long Straddle | Calendar Spread |
|---|---|---|
| Vega | Long (needs IV to rise or stay high) | Net long (but depends on term structure — see Greeks section) |
| Theta | Negative (time hurts) | Positive (time helps) |
| Direction | Profits from large moves | Profits from small moves |
| Cost | Higher (two options, same exp) | Lower (near-term short offsets) |
| Best when | Expecting a breakout | Expecting quiet |
They’re mirror images of each other in terms of stock movement preference. Experienced traders use calendars when they expect quiet, and straddles when they expect a breakout.
Diagonal Calendars: Adding a Strike Offset
A standard calendar uses the same strike for both legs. A diagonal calendar uses different strikes — typically selling a higher-strike near-term option and buying a lower-strike far-term option. This combines the time spread mechanics with a directional bias.
Diagonals are the foundation of the Poor Man’s Covered Call, which we cover in the next article.
Key Takeaways
- A calendar spread = sell near-term option + buy same-strike far-term option; net debit trade
- Profits when the stock stays near the strike at near-term expiration — the short decays faster than the long
- Greeks: Positive theta (time helps), net positive vega (broadly benefits from rising IV, but performance depends on how IV moves across the term structure — not just the overall level)
- Use for quiet period income (theta harvest) or pre-earnings IV expansion plays (with careful timing)
- Close at 25–50% profit on the debit; cut losses if the stock moves significantly away from the strike
- After near-term expiry, the remaining long option can be rolled again — calendar spreads are naturally “chainable”
What’s Next
Calendar spreads use two expirations with the same strike. Now apply that logic with different strikes to replicate an entire covered call strategy — at a fraction of the capital: The Poor Man’s Covered Call: LEAPS as a Stock Substitute.
Calendar spreads require managing two expirations simultaneously — Tastytrade handles this cleanly, letting you place the full calendar as one order across expirations and track the combined position P&L in a single line on your portfolio page.
Disclosure: this is a referral link. If you sign up via this link, the site may earn a commission at no cost to you.
Disclaimer: This content is for educational and informational purposes only and does not constitute financial, investment, or trading advice. Options trading involves significant risk and is not suitable for all investors. You may lose the entire amount invested. Always conduct your own research and consult a licensed financial advisor before making investment decisions.